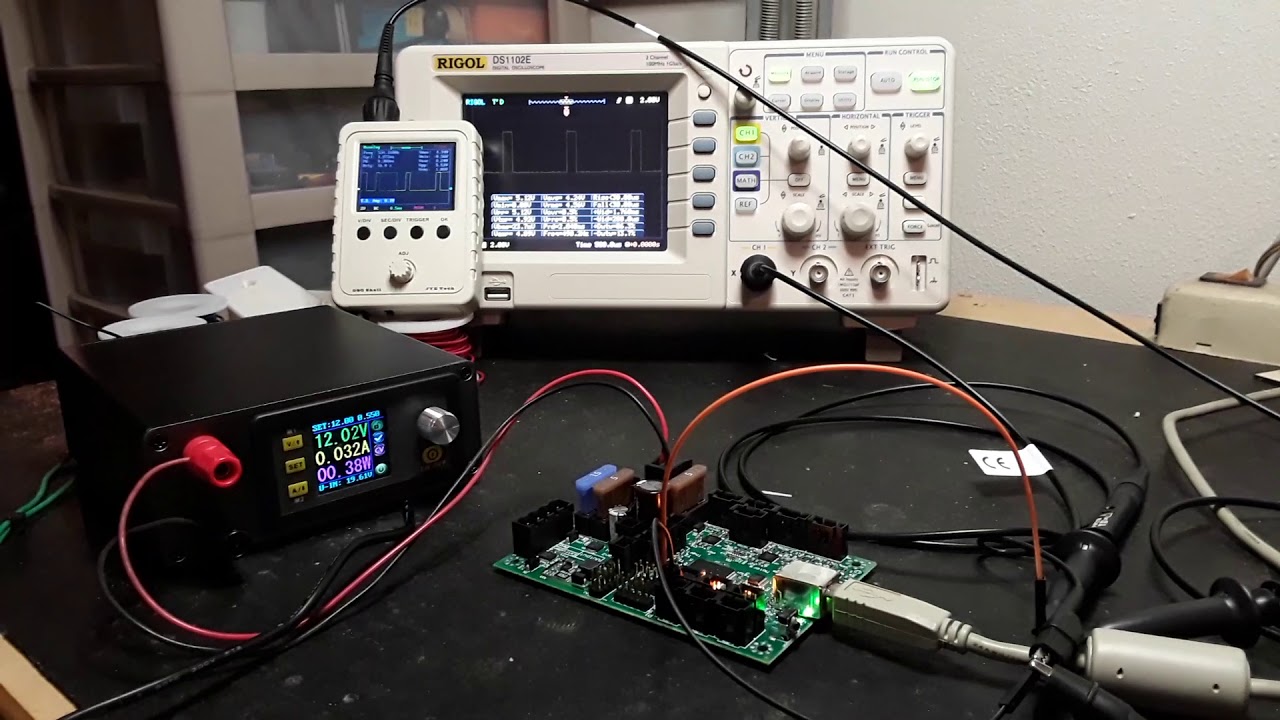
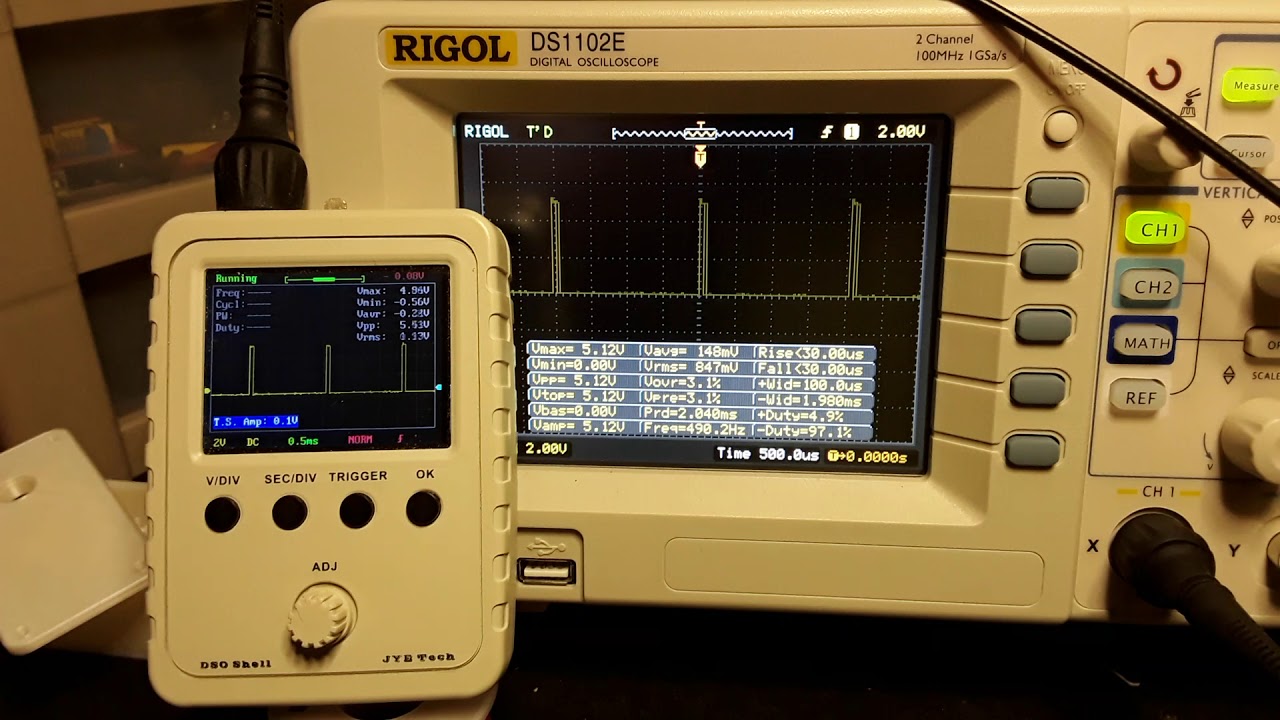
Fundamentally, an oscilloscope is just a voltmeter that displays voltage vs time in the form of a plot. Almost all of the adjustment you’re doing when working with the scope is zooming in and out, both in time and voltage, setting a trigger point which is what causes the scope to start displaying what it sees on the screen and the position of where that start point is, relative to the screen.
So if you were looking at an unknown digital signal, you’d start by adjusting the volts per division knob. This changes the ‘zoom’ in the Y or voltage direction, so making the scope more sensitive means that the same waveform will be ‘taller’ on the screen. If the waveform is too small then you’d make it more sensitive to take up more space. If you can’t see the waveform or it’s disappearing off the screen, you’d lower the sensitivity. You can also adjust the voltage offset which essentially moves the viewport of the screen up and down. In the case of our random digital signal, you might adjust it so that the volts per division is at 2.5V per division and the waveform is taking up 2 divisions on the screen, meaning it’s a 0-5V waveform.
Once you have an idea of the voltage of the signal, you can adjust the trigger. This is what the scope looks for and tells it where the ‘start’ is for the waveform you want to look at. The simplest form of this would be a fixed voltage and then a transition direction. For our 0-5V waveform above, we can set the trigger level to be halfway between the high and low and then set it to only trigger on a positive going edge. That way the scope will wait until it sees the waveform go from say 2.4V to 2.6V and will then trigger, showing what it has recorded to you with that trigger point in the middle of the screen.
The next thing would be adjusting the timebase. This is zoom in the X or ‘time’ direction. If you’re seeing nothing but 2 lines with an occasional brief blip between them, you’re probably too zoomed in. If you’re seeing a ‘fuzz’ of loads of transitions between 0V and whatever a digital 1 is, you’re probably too zoomed out. Once you’ve got it so that you can comfortably see a bunch of pulses on the screen then you can look at the timebase setting and figure out what the frequency/duty cycle is. If we’re seeing a few pulses on the screen with 2 divisions between each positive going edge, we can look at the timebase to see what that means. If the timebase is set to 1ms then we know that the period of the signal is 2ms and the frequency is 500Hz. We can also see what the duty cycle is just by looking at it.
The next things we can do are things like adjusting the trigger offset, which essentially moves the trigger point left and right on the screen. A modern digital scope is always recording so you can have the trigger set either ‘before’ what you can see on the screen or after. Maybe you have a pulse that only occurs sometimes and you want to see the 100ms of time that leads up to that pulse, or what happens 1s after the pulse. You can do that by moving the trigger.
You can also then start to set up other stuff like math functions that will measure what’s on the screen for you. These can give you an easily readable number that shows you the maximum voltage, minimum voltage, peak-to-peak voltage, the frequency, the duty cycle etc. It can also give you statistics on those numbers so you know what the average, minimum, maximum and standard deviations of those measurements are.
You can have the scope in ‘free running’ mode, where it will always show you the latest measurements, regardless of whether it’s triggered or not. You can have it in trigger only mode where it only shows you stuff when it’s seen a trigger event. You can have the pause the scope to keep what’s on the screen from changing. You can set it to single shot where it will only run once when it triggers and will then pause.
Once the scope is paused, you can zoom in and out on parts of the signal. The screen might only show you 1000 points, but the scope may have captured millions of points in that same time period, so you can find a spot you want to look at and zoom in up to thousands of times ‘closer’.
You can also adjust the trigger type to be a little more complex. You might adjust it to look for pulses that are below a minimum width, which means the scope will need to see a positive going edge and then a negative going edge within say 1us. If you have a communications bus like SPI or the switch in a switch-mode power supply, this would be a situation that should never occur. Then you can set the scope to one-shot mode and wait to see if it triggers. If it doesn’t, you don’t have an issue, but if it does you can now clearly see that issue as it occurs.
You can then hook up other channels as well, which are always synchronized to one another. So you might be looking at 2-4 different voltages all at the same time. You choose to trigger off one, perhaps the clock on a data bus, but you can see what the other signals are doing at the same time. You could put one probe on a chip select line and use that as a trigger, then put the other probes on the clock and data lines. When the chip select line gets asserted, the scope can trigger and capture you an entire communications event. You can use the runt pulse trigger described above and look at the feedback lines of a switch-mode power supply to see what might have caused it. You could look at the supply voltage for a chip with one channel and the output of the chip with another.
All sorts of stuff like that.
This is kinda why it’s hard to describe what a scope does. It’s ultimately just showing voltage vs time, but what you can do with that is the fundamental building block of almost all electrical engineering.
From a quick google, Sparkfun seem to have a decent bit of information:
https://learn.sparkfun.com/tutorials/how-to-use-an-oscilloscope/all
Edit:
There are also a bunch of virtual oscilloscopes in web, app and downloadable executable form for training.
This one seems reasonable:
https://automatisierung.fh-aachen.de/virtuallab/scope/dist/
You can control the knobs by mousing over them and moving the scroll wheel, can adjust the trigger slope, all the basics. You can also adjust the type of waveform you’re feeding into it.


