Curious if anyone’s using VS Code (on Windows), or something else (STM Cube IDE? ) to attach a debugger to debug Marlin? Trying to figure out whether stlink, jlink, jtag or something else should be used.
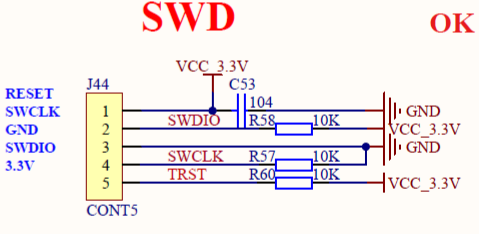
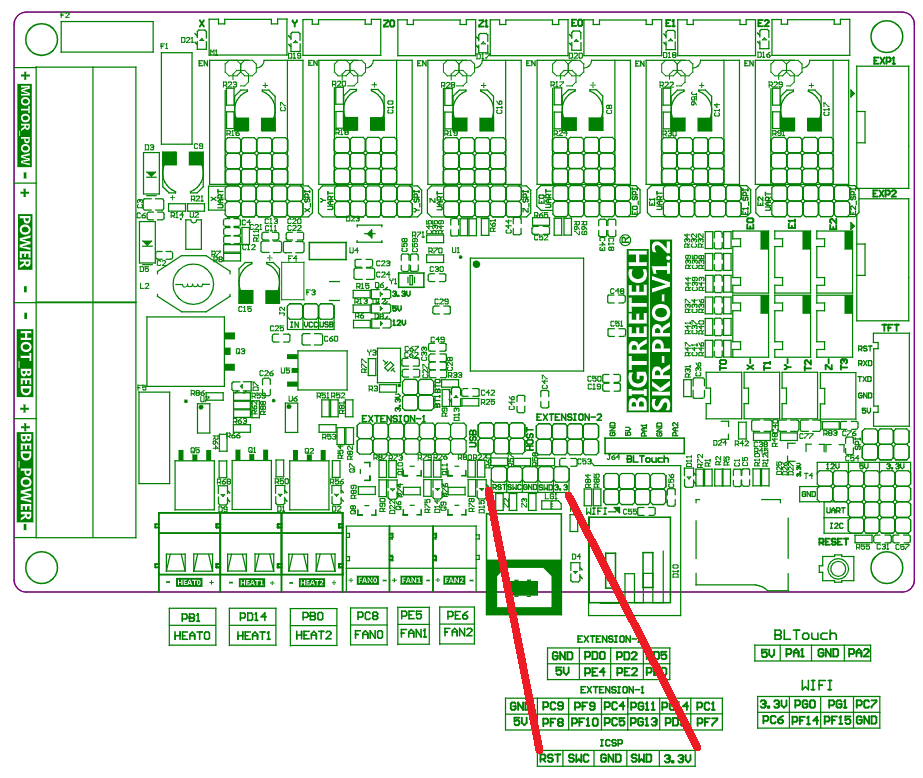
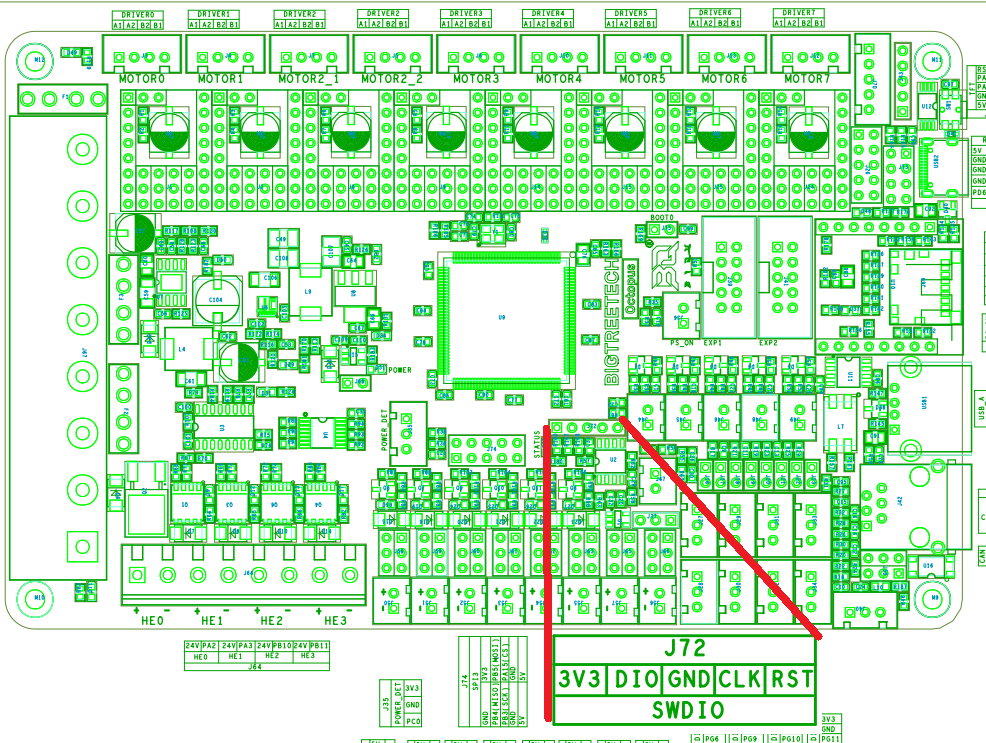
Looks like debugger dongle should be attached to SWDIO header.
I’ve never liked debuggers, but I know a lot of people live by them. Just curious what you are trying to do? A lot of the worl from Marlin is done in real time and a lot of the stepping is done in interrupts.
Mainly trying to understand the code structure better, when possible stepping through helps me grasp what’s going on better than just reading and skipping around the code base. Stepping through new/modified code is always helpful.
I appreciate debugging some areas (interrupt/time-sensitive) will be invasive/disruptive to functionality and will probably be better understood by maybe temporarily adding a bunch of SERIAL_ECHO messages to generate debug spew to console or SD file? This is my plan B if a debugger dongle is required. I have a ESP Programmer board that can be used to debug ESP32 via JTAG, no idea if that can be used for SWDIO as well, I need to ST*W more…
Curious if there’s some other approach folks use when modding firmware?
Yeah, writing code that spews intentionally considered traces/logs containing the right amount of context rich information has helped me/colleagues too. On the other hand, have seen mindlessly coded tracing kill performance, and functionality even.
Logs/traces are required to debug Dev, and Production scenarios. If you’re weird, it’s not because of using log statements, probably